How to Trace the Feedback Loops

You have mapped the system. You have identified who profits. And now you understand the structure. You see who has power. Who extracts. Who benefits. But structure alone does not explain dynamics. Does not explain why problems get worse. Why small issues become crises. Why systems, once broken, stay broken. Or break further.
To understand that, you need to understand feedback loops. Loops are the engines of change. They are what make systems move. Evolve. Spiral. And once you can see loops, you can see why problems persist. Why solutions fail. And where intervention might actually work.
A feedback loop is simple. It is a circle. A causes B. B causes C. C causes A. And the loop repeats. Reinforcing itself. Or balancing itself. And the behavior of the system, the trajectory, is determined by which loops dominate. Reinforcing loops that amplify. Or balancing loops that stabilize.
And most broken systems are dominated by reinforcing loops. Vicious circles. That make problems worse. That turn small dysfunctions into large ones. And that resist correction. Because every attempt to fix them triggers the loop. Which makes things worse again.
Let me show you how to trace feedback loops. How to see them. How to draw them. And how to understand what they reveal.
The first step is to identify a problem that is getting worse. Not a static problem. Not something that is just bad. But something that is deteriorating. Growing. Accelerating. Because deterioration is the signature of a reinforcing loop. And if you want to understand why something is getting worse, you need to find the loop.
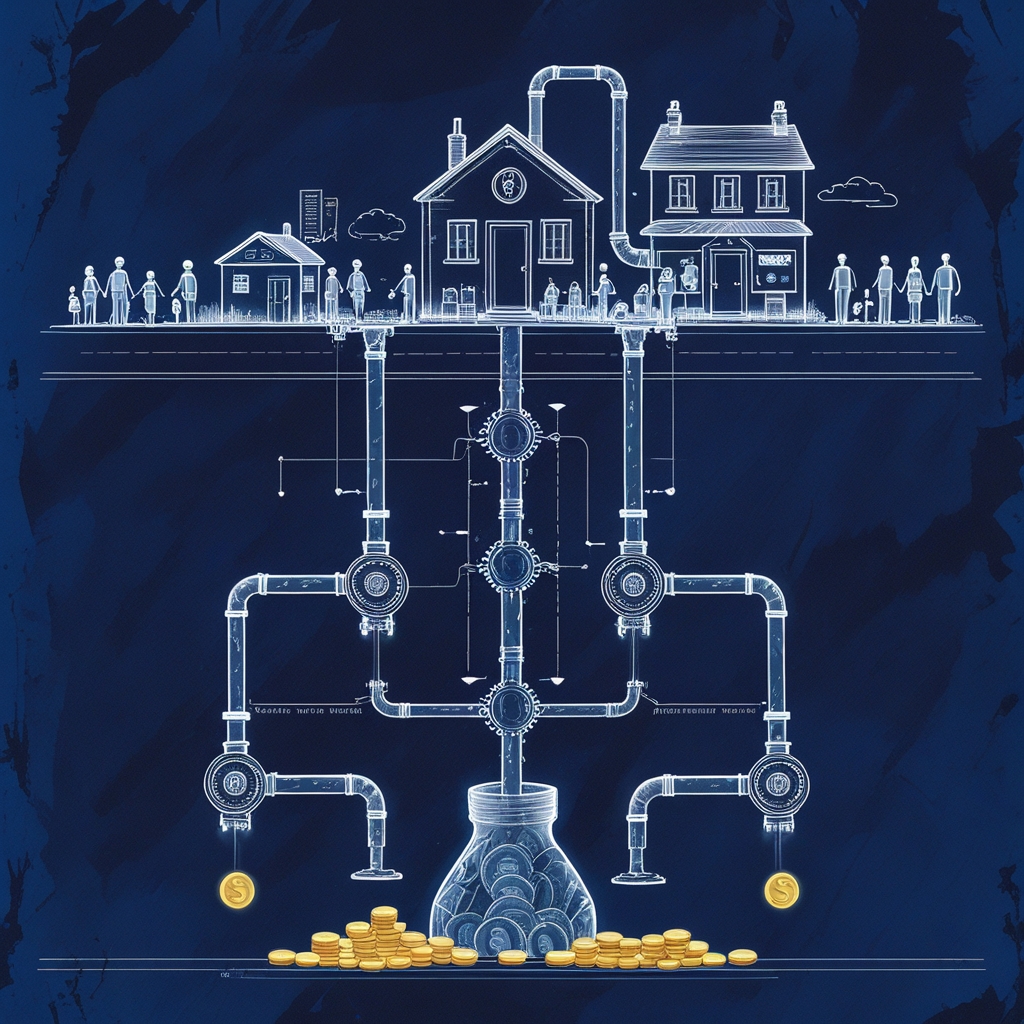
Let me give you an example. Rents are rising. Not just this year. Every year. Faster than wages. Faster than inflation. Why? What is driving that?
Start with the observation. Rents are rising. And ask: what does rising rent cause? What happens because rents are high?
High rents make saving difficult. Tenants pay more. Have less left over. So they cannot save for a deposit. Cannot buy. So they stay renters. And demand for rental housing stays high. Or increases. Because people who might have bought are still renting.
And high demand, with constrained supply, drives rents higher. So rents rise. Which makes saving harder. Which keeps people renting. Which keeps demand high. Which drives rents up further. This is a loop. A reinforcing loop. And it spirals. Each iteration makes the problem worse.
So the first step is simple. Identify the problem. And ask: what does this problem cause? What happens because of it? And does that effect make the problem worse? If yes, you have found a loop.
The second step is to draw the loop. Visually. On paper. Or on a screen. Because seeing the loop, seeing the circle, makes it clear. Makes it undeniable.
Draw the problem in the center. Rents rising. Draw an arrow. To the next effect. Saving harder. Draw another arrow. To the next effect. Staying renters. Draw another arrow. To the next effect. High demand. Draw another arrow. Back to the start. Rents rising.
You have drawn a circle. A loop. And now you can see it. See how each element feeds the next. And how the last element feeds back to the first. Reinforcing. Amplifying.
And label the loop. Reinforcing or balancing. If the loop amplifies the problem, it is reinforcing. If it dampens the problem, it is balancing. In this case, the rent loop is reinforcing. It makes rents rise faster. So label it. R. For reinforcing.
The third step is to look for delays. Delays are gaps. Between cause and effect. Between action and consequence. And delays are critical. Because they prevent correction. They hide the connection between cause and effect. And they allow loops to spiral before anyone realizes what is happening.
In the rent loop, there is a delay. Between rents rising and the effect on homeownership. Rents rise. But people do not immediately give up on buying. They try. They save. Slowly. Over years. And only after years of high rent, of failed saving, do they accept that buying is impossible. And stay renters. Permanently.
So the delay is years. And during those years, the loop is invisible. People do not see the connection. Between high rents and high rental demand. They just see that rents are high. And assume it is temporary. Or that they are unlucky. Or that they need to work harder. But the loop is operating. Reinforcing. And the delay hides it.
So when you trace loops, look for delays. Ask: how long does it take for this effect to manifest? And if the delay is long, the loop is harder to see. Harder to interrupt. And more dangerous.
The fourth step is to identify multiple loops. Because systems do not have one loop. They have many. Interacting. Reinforcing each other. Or counteracting. And the behavior of the system is the result of all the loops. Together.
Go back to rents. We identified one loop. High rents keep people renting. Which keeps demand high. Which keeps rents high. But there are other loops.
Another loop: high rents attract landlords. Buy-to-let investors. They see high rents. High yields. And they buy properties. To rent out. And every property they buy is a property that could have been owner-occupied. So supply for buyers falls. Prices rise. And more people, priced out, become renters. Demand for rentals rises. Rents rise. And the loop continues.
Another loop: high rents create financial stress. Tenants struggle to pay. Some fall into arrears. Some are evicted. And evictions create homelessness. Homelessness creates costs. For councils. For the NHS. For society. And those costs are funded by taxes. Or by cuts elsewhere. And cuts reduce services. Reduce support. Which increases stress. Which increases arrears. Which increases evictions. The loop spirals.
So systems have multiple loops. And those loops interact. One loop drives another. And together, they create the trajectory. The system's behavior. And tracing all the loops, or at least the major ones, gives you the full picture. The full dynamic.
The fifth step is to distinguish reinforcing loops from balancing loops. Because they behave differently. And they require different interventions.
Reinforcing loops amplify. They make things bigger. Or smaller. But they do not stabilize. They accelerate. Growth. Decline. Wealth concentration. Debt accumulation. All reinforcing loops. And they spiral until something breaks. Until they hit a limit. Or until a balancing loop kicks in.
Balancing loops stabilize. They push back. They resist change. If something rises, a balancing loop brings it down. If something falls, a balancing loop lifts it. Thermostats are balancing loops. Temperature rises. Thermostat turns off heating. Temperature falls. And balances.
In markets, supply and demand are supposed to be a balancing loop. Prices rise. Supply increases. Demand falls. Prices fall. And balance. But in housing, this loop is broken. Because supply does not respond. Planning restrictions prevent it. So prices rise. And stay high. The balancing loop does not operate. And reinforcing loops dominate.
So when you trace loops, ask: is this reinforcing or balancing? And if the system is broken, chances are the balancing loops are weak. Or broken. And the reinforcing loops are strong. Dominant. And that is why the problem spirals.
The sixth step is to identify what strengthens the loop. What makes it faster. Stronger. More powerful. Because loops are not static. They evolve. And understanding what amplifies them tells you what to target. If you want to weaken the loop. Or break it.
In the rent loop, what strengthens it? What makes rents rise faster?
Undersupply. If supply is very constrained, rents rise faster. Because demand exceeds supply by a larger margin. So undersupply amplifies the loop.
High mortgage requirements. If banks require large deposits, more people are excluded from buying. So more people rent. Demand rises. Rents rise. So restrictive lending amplifies the loop.
Landlord tax advantages. If landlords get tax relief on mortgage interest, on expenses, their costs are lower. They can outbid buyers. Buy more properties. Reduce owner-occupied supply. Force more people to rent. Amplifying the loop.
So amplifiers are structural features. Policies. Regulations. Incentives. That make the loop stronger. And identifying them tells you where to intervene. Remove the amplifier. Weaken the loop.
The seventh step is to look for tipping points. Points where the loop accelerates. Where slow change becomes fast. Where the system crosses a threshold. And spirals.
Tipping points happen when reinforcing loops overwhelm balancing loops. When the forces amplifying exceed the forces stabilizing. And once crossed, the system changes state. Rapidly.
In housing, the tipping point might be when rental costs exceed a certain percentage of income. Say fifty percent. At that point, tenants cannot save. Cannot improve their situation. They are trapped. And the loop, which was already reinforcing, accelerates. Because trapped tenants have no alternative. No exit. So landlords can raise rents without losing tenants. And rents spiral.
Or the tipping point might be when homeownership falls below a certain level. Say forty percent. At that point, renters become the majority. And politically, they could organize. Demand change. But if they do not, if they stay atomized, landlords dominate. And the system locks in. Permanently.
So when you trace loops, ask: is there a tipping point? A threshold? Where the dynamic changes? And have we crossed it? Or are we approaching it? Because tipping points are critical. They are moments where intervention is urgent. Before the system locks into a worse state.
Now let me give you common loop patterns. Templates. That appear in many systems. And recognizing these patterns makes tracing loops easier. Faster.
Pattern one: The scarcity loop. Scarcity drives up prices. High prices attract investment. Investment reduces supply for users. Scarcity increases. This appears in housing. In rental markets. In education. Anywhere scarcity is profitable.
Pattern two: The debt spiral. Debt requires payments. Payments reduce income. Reduced income requires more borrowing. Debt grows. This appears in consumer debt. In payday loans. In student loans. In national debt.
Pattern three: The skill drain. Poor conditions drive away skilled workers. Fewer skilled workers reduce quality. Reduced quality worsens conditions. More workers leave. This appears in the NHS. In teaching. In social care.
Pattern four: The trust erosion loop. Poor service reduces trust. Reduced trust reduces cooperation. Reduced cooperation worsens service. Trust falls further. This appears in policing. In local government. In institutions.
Pattern five: The complexity creep loop. Complexity creates errors. Errors require fixes. Fixes add more rules. More rules create more complexity. This appears in regulation. In bureaucracy. In tax systems.
Recognizing these patterns helps. Because once you see the pattern, you know the loop. And you know where it leads. And you can intervene. Before it spirals.
Now let me give you a practical method. For tracing any loop.
Step one: Identify a problem that is getting worse. Write it down.
Step two: Ask: what does this problem cause? What happens because of it? Write that down. Draw an arrow from the problem to the effect.
Step three: Ask: does this effect make the original problem worse? If yes, draw an arrow back. You have a loop. If no, ask: what does this effect cause next? And continue. Until you find the loop.
Step four: Draw the full loop. All the elements. All the arrows. Make it visual.
Step five: Label it. Reinforcing or balancing. R or B.
Step six: Look for delays. Where are they? How long? Mark them.
Step seven: Identify what amplifies the loop. What makes it stronger? Faster?
Step eight: Check for tipping points. Thresholds where the loop accelerates.
Step nine: Look for other loops. Interacting with this one. Draw them. See how they connect.
And once you have done this, you see the dynamic. You see why the problem is getting worse. You see what is driving it. And you see where intervention might work. Break the loop. Weaken it. Slow it. Or reverse it.
And this is powerful. Because most people see problems as static. As things that just are. But systems thinkers see problems as dynamic. As loops. As processes. That can be interrupted. That can be changed.
And once you see the loops, you cannot unsee them. You see them everywhere. In your workplace. In your relationships. In politics. In markets. Everywhere. And you understand. Why things are the way they are. And why they are so hard to change. Because loops are strong. Self-reinforcing. And resistant.
But they are not invincible. They can be broken. They can be weakened. And the next article will show you how to identify why systems resist change. Why, even when loops are visible, even when solutions are obvious, nothing happens. Because resistance is structural. Political. And understanding it is the key to overcoming it.